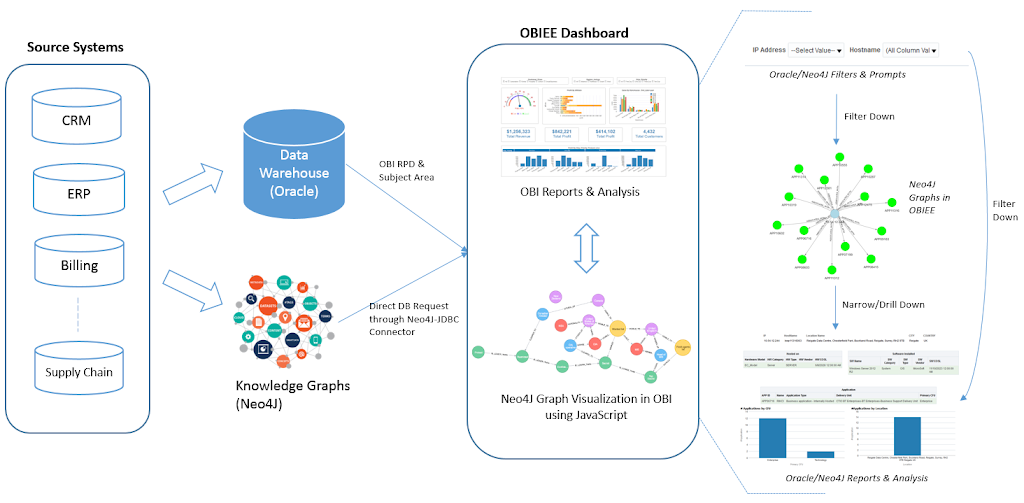
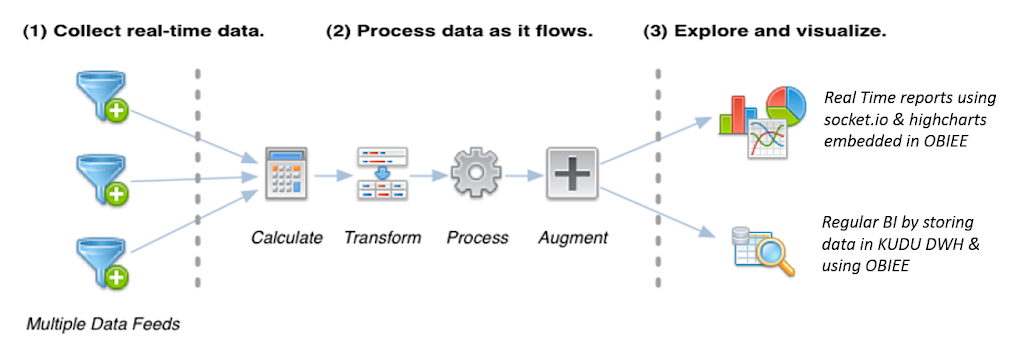
In this entry, I will be showing you the process of embedding a D3 visualization in OBIEE 11g. I’ve had the pleasure of working on this technology where i have to display some kind of BOM hierarchy using the D3 charts. As a part of POC on this one, i started on simple virtualization taking examples from various websites. I will be sticking on OBIEE development rather that D3, so without further adieu lets start.
What is D3?
D3.js is a JavaScript library for manipulating documents based on data. D3 helps you bring data to life using HTML, SVG and CSS. D3’s emphasis on web standards gives you the full capabilities of modern browsers without tying yourself to a proprietary framework, combining powerful visualization components and a data-driven approach to DOM manipulation.
reference: d3js.org
Embedding Concept
OBIEE has the concept of narrative view in which you can embed your own javascript and view the end results as per your design definition.
Lets’ take a simple example given at rittman’s blog to develop similar application.
OBIEE has the concept of narrative view in which you can embed your own javascript and view the end results as per your design definition.
Lets’ take a simple example given at rittman’s blog to develop similar application.
Target:
Based on the total sales for each customer each month, customers are placed in the scoring groups
- Group 1: Customers for which revenue exceeded £10,000
- Group 2: Customers for which revenue exceeded £5,000
- Group 3: Customers for which revenue exceeded £2,000
- Group 4: Customers for which revenue exceeded £0
At the end of each month we want to compare each customers current scoring group with the scoring group they occupied the previous month. It’s the movement of customers between groups each month that we are interested in analysing.
Lets’ start by creating the above model.
Step 1:
Step 2:
Import the table in Physical Layer
Step 3:
Create the Business Model and drag the CUSTOMER table twice from physical layer and name one as Customer-T. Drop all the columns except Cust-ID which will serve us in creating a join in BMM.
Step 4:
 |

|
Define the relationship as defined above in BMM layer.
Step 5:
Pull the 2 tables in Presentation layer, save the rpd and host it.
Step 6:
Create the report using Customer, Group_last_month, Group_This_Month and Movement from the Customer Table.
Now to create the D3 view we have to add the narrative view in obiee. After adding, specify:
Prefix:Narrative:
Postfix:
The report looks like the one above. One can add other visualizations using this feature.


Hi Mohammad,
Please follow my other page:
http://www.parikshitag.com/2015/01/obiee-visualization-d3j-charts-part-3.html
Hi This is really nice example. Could you please help me to implement Collapsible Tree example in OBIEE.
https://bl.ocks.org/d3noob/43a860bc0024792f8803bba8ca0d5ecd