So, let’s start by understanding the EBS table structure.Vision BOM contains three important tables namely:
Columns:
ORDER_LEVEL: This represent the assembly_item order level(order 1 being the root)
ASSEMBLY_ITEM: Assembly Item name.
COMPONENT_ITEM: Immediate component name that follows its parent assembly item.
ASSEMBLY_DESCRIPTION: Assembly Item description
COMPONENT_ITEM_DESCRIPTION: Component Item Description.
PATH: Trace Path from root item to the current item.
ORGANIZATION_ID: Organization to which Item belongs.
Import this view into the rpd, create an alias, pull the view in BMM layer,create replica of it and make a logical join.Now, add this to presentation layer and host the rpd.
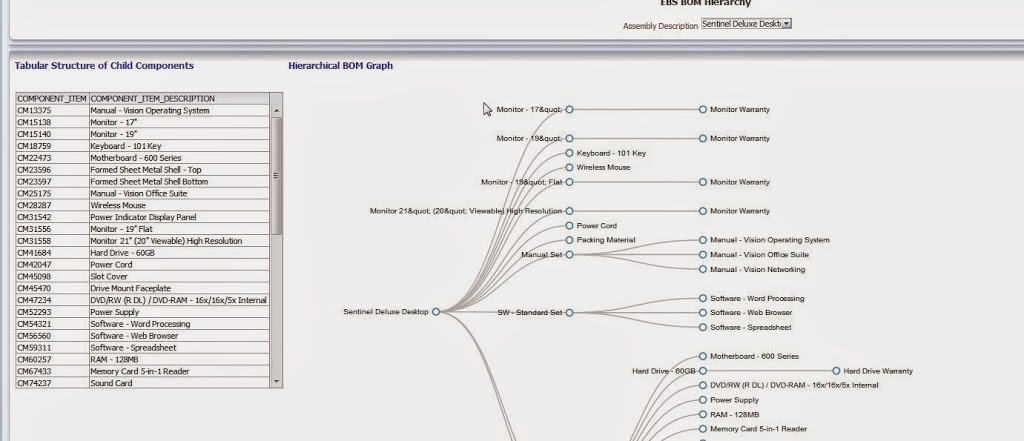
Now using the D3 charts described in part 1 and part 2 you can able to represent the data using narrative view. In this example, D3 chart is taken from here.
Comment below if you like the post.


