Introduction:
The purpose of this article is to analyze and bring insights from statistical data from data warehouse and graphical data from Neo4J. Today’s most pressing data challenges center around connections, not just discrete data. At the same time, most of the business data gets stored to relational databases in form of tables. The challenges lies at the inception of the graph DB as to how we can narrow down our searches from one technology to other or integrate both we can reach proper business decisions.
For e.g. We have modeled our graphs to the best and it can answer all the things you can throw at it but how should we see that data and its associations with other business dimensions at a glance.
The problem statement
- How to narrow down search from relational model to graphical model?
- Drill down from graphical model to relational model
- How to see data relationships without writing complex cyphers
I have divided the above problem statement in multiple steps listed below and we’ll work upon each of it in detail
- Integrate OBIEE with Neo4J directly and do reporting on top of it
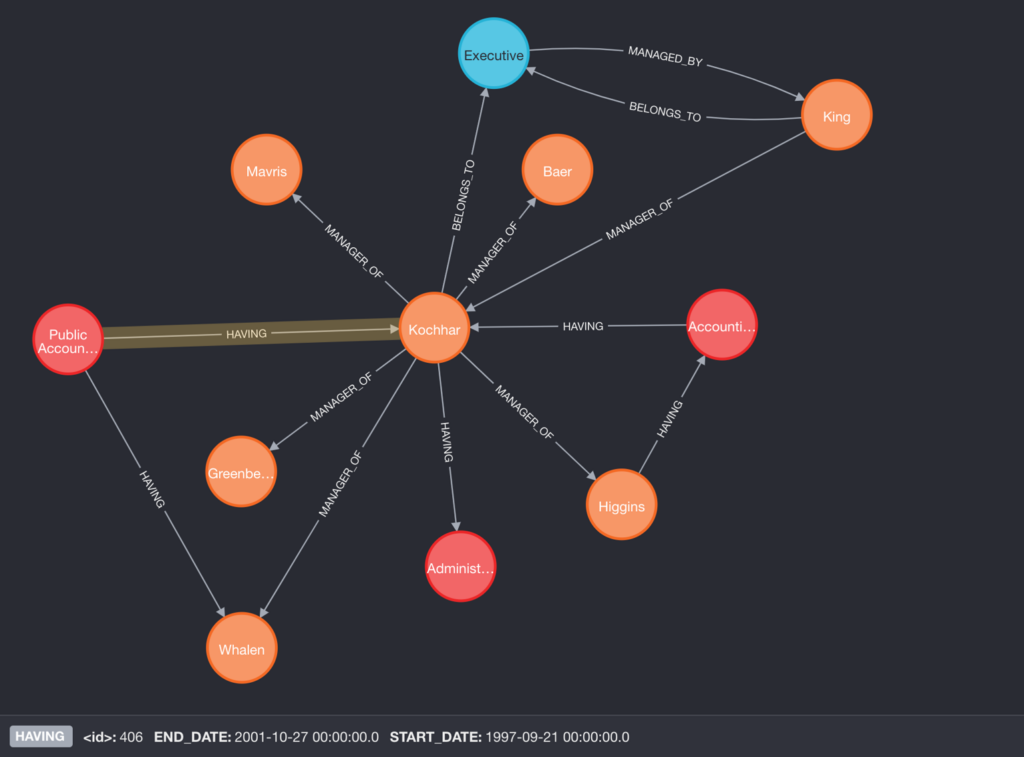
- Create Graph visualization in OBIEE so as to project our neo4j data.
- Create oracle reports/charts & neo4j visualizations and navigate among them in a single dashboard
Objective: To integrate OBIEE with Oracle DB & Neo4J and navigate to/fro from graph and Oracle reports in single dashboard.
Integrate OBIEE with Neo4J Database
To integrate OBIEE & Neo4J we’ll leverage the neo4j-jdbc connector provided by Neo4J. You can download the driver from here. The latest driver at the time of writing is 3.4, if you are working on newer Neo4J version you have to update the driver as mentioned in “Building the driver yourself” section at this page.
Once downloaded, we have to follow the exact steps as mentioned on this blog page. You should end up with creating the connection pool with jndi/neo as the data source. Please note that since Neo4J is a graph database we’ll not be able to model our rpd. We only have the option to create direct database request analysis in OBIEE.
The next step is to create direct database query analysis from obiee and enter connection pool information that you have just created. In the SQL statement, we can write our regular Neo4J cyphers and get the result. (Pretty cool right, I know 😛 )
(Please feel free to ask if you are stuck in building the driver or in any other steps above)
Creating Graph visualizations in OBIEE
Once we have integrated our Neo4J instance and can fetch the data, the next step is to create the graph visualization. For this we’ll create our custom visualization using javascript with the help of narrative view of OBIEE as obviously OBIEE doesn’t provide graph visualization out of the box. I have already written about creating graph visualization in obiee here, so please refer to it.
Please note, we can also create any other visualization or views that obiee provides with this data. Also, by now we’ll have reports having data either from Neo4J or some other relational database using regular RPD stuff. The next step is to just navigate among these reports irrespective of underlying data source.


